How to Make an Interactive Diagram: Step by Step
Turn an existing diagram into a clickable, testable learning experience with clear hotspots, labels, feedback, accessible text, and mobile checks.
This guide starts with a diagram that already exists as an image. It shows how to make its parts clickable, explain the relationships, and check what a learner understands. It is not a guide to drawing a flowchart or programming a diagram library.
A good interactive diagram keeps the visual as the main source of evidence. Interactions should direct attention, ask for a decision, or explain a relationship. They should not turn a clear diagram into a wall of buttons.
Start with the job, not the tool
Write one observable outcome before you add a marker. For a solar panel system, a useful outcome is: “Trace how energy moves from sunlight to the building and the electrical grid.” “Understand solar power” is too broad to guide the design.
Then decide what evidence would show success. A learner might identify the inverter, label the main components, or select the energy path in order. Each action calls for a different interaction.
Prepare a clear source diagram
The base diagram must work before it becomes interactive. Use readable labels, clear boundaries between parts, and enough empty space for markers. Remove decoration that competes with the components people need to inspect.
- Export at a size that keeps small labels sharp.
- Keep color contrast strong enough to survive smaller playback.
- Use consistent arrows for direction and flow.
- Leave important parts visible when a marker sits nearby.
- Check that the image tells a coherent story without interaction.
Choose the right interaction model
Do not add several interaction types because they are available. Match one action to the evidence you need from the learner.
Interaction chooser
Start with the action the learner should take
Reveal
Info hotspot
Open an explanation for one part
Identify
Click region
Select the correct area on the diagram
Label
Label image
Match names to the correct parts
Order
Sequence regions
Choose stages in the correct order
Compare
Compare regions
Inspect two areas using one prompt
Guide
Guided tour
Follow an authored route through the parts
Drill down
Add zoom scene
Draw a doorway into a manually uploaded deeper image
A zoom scene is useful when the learner needs to enter another image level, such as moving from a machine diagram into one component. In the same Image Studio, choose Add element, then Add zoom scene. Draw the doorway over the relevant area and upload its destination image manually. The deeper image keeps the same element tools as the starting image.
Create the image canvas
Create an interactive image
Every diagram starts with one source image in Image Studio. You can add explanations, questions, overlays, and connected zoom scenes from the same editor.
Upload or create the source
Upload your prepared diagram, or use the ordinary smart-graphic option when it is available in the creator. The current allowance appears in the interface.
Add the title and image description
Name the exact system or process and describe the diagram for people who cannot rely on the image alone.
Continue to the editor
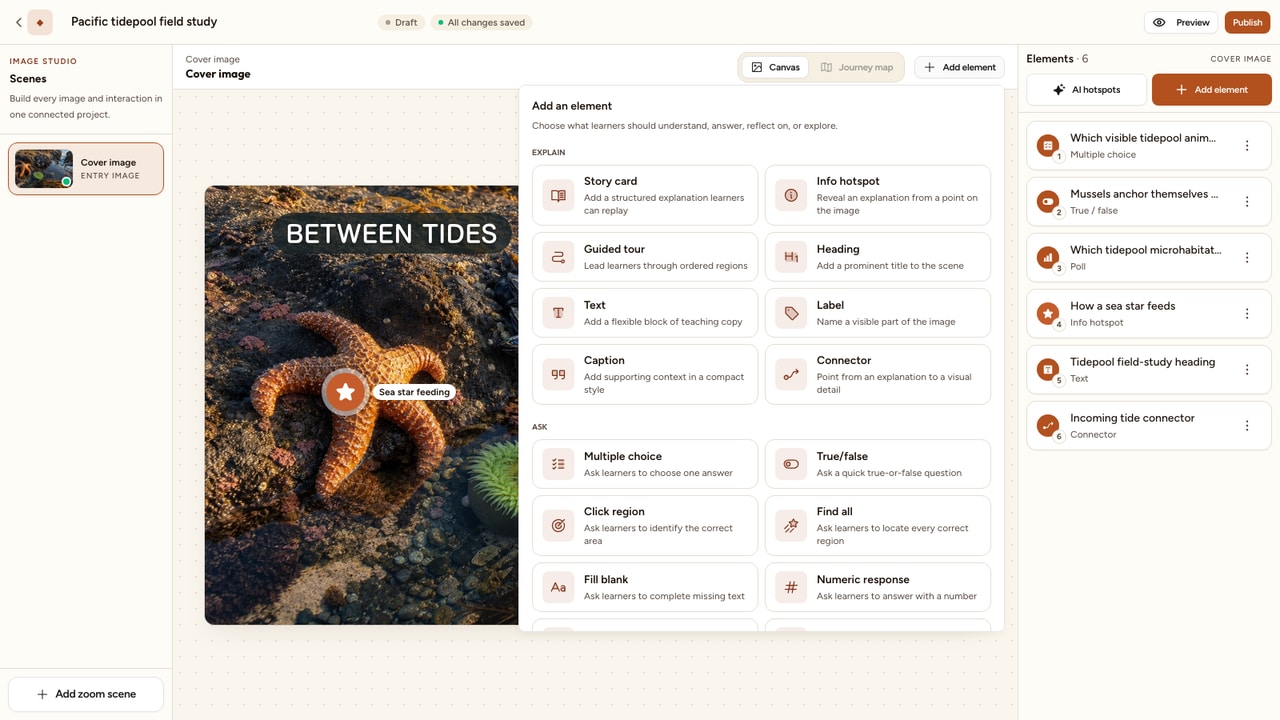
Use Add element to choose what belongs on the scene. Place it on the canvas, then use the inspector for content, answers, feedback, geometry, and marker settings.
Write a useful image description
A short alt text identifies the image. A complex diagram often needs a longer text explanation that describes the relationships, sequence, or data needed to understand it. The W3C guidance for complex images recommends giving people the same essential information in text.
For the solar example, “Diagram of a rooftop solar system” identifies the image but does not explain it. The longer explanation should trace sunlight to the panels, direct current to the inverter, alternating current to the meter and building, and any surplus to the grid.
Add explanations without covering the diagram
Use information hotspots for concise explanations that belong to one component. Use text labels and connectors when the source needs a small amount of persistent guidance. Use a guided tour when sequence matters and the learner should visit parts in an authored order.
Keep markers near their subjects, but move them to an edge if placing them on top would hide required evidence. A connector can preserve the relationship without covering the part itself.
Design image hotspots people can find and understand
Use the practical guide to placement, labels, target size, marker style, collisions, feedback, and mobile checks.
Add practice and assessment
- Label image: match terminology to the correct parts after learners have explored them.
- Click region: identify one visible part or stage from a prompt.
- Find all: locate every hazard, component, or example that fits a rule.
- Sequence regions: select a process path or set of stages in order.
- Compare regions: inspect two areas before explaining a difference.
Objective questions and configured spatial activities can be graded automatically. Polls and rating scales collect responses rather than scores. Free responses can use keyword grading or remain pending for educator review.
Write feedback that teaches
“Correct” confirms a result but teaches little. Useful feedback names the visual evidence and relationship. For example: “The inverter is the correct part because it changes the panels' direct current into the alternating current used by the building.”
For a wrong region, explain what that part does and point the learner back to the relevant clue. Avoid feedback that simply repeats the original prompt.
Style markers to preserve the image
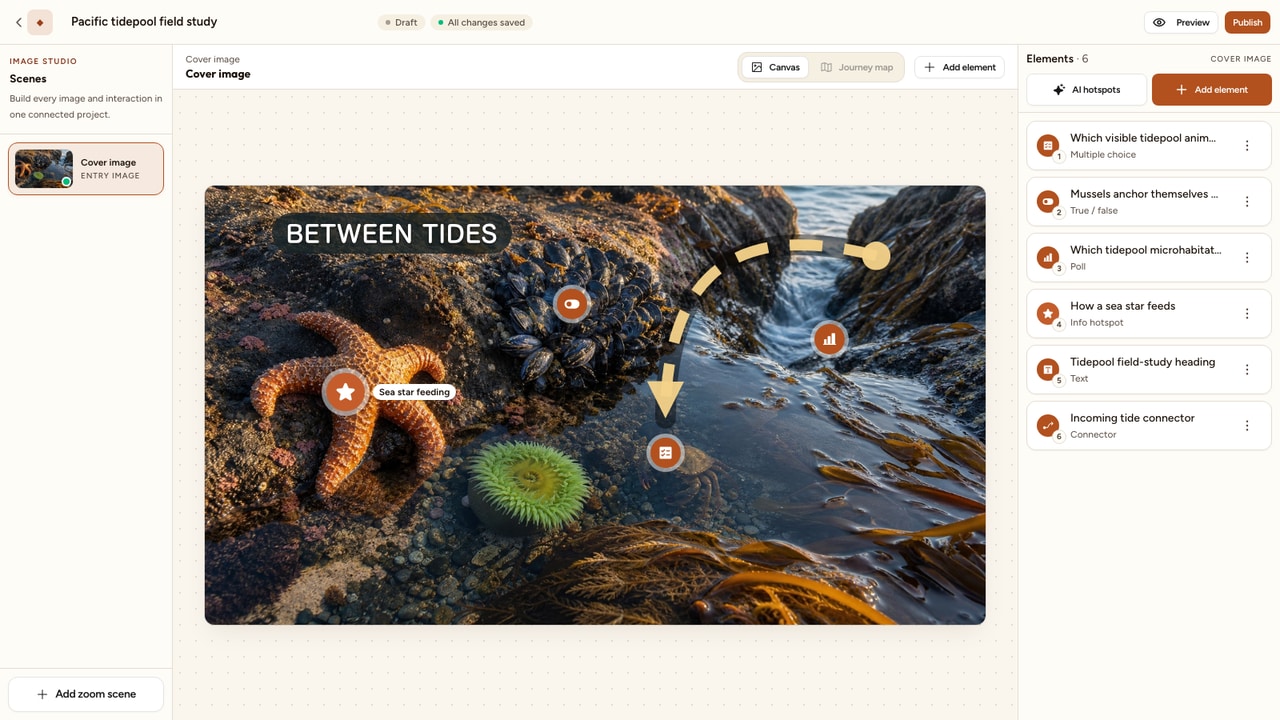
Ordinary image interactions start with the Classic marker, labeled Legacy in the editor. You can choose Classic, Prism, Focus, Orbit, or Edge, then adjust tint, icon, S/M/L size, pulse, label visibility, and the custom label. Zoom doorways start with Focus.
Use the quietest treatment that remains discoverable against the real image. Color should not be the only cue. A specific icon and label make the action easier to predict.
Worked example: a solar panel system
The source image shows a rooftop panel, inverter, meter, building, and grid connection. The first pass explains each component. The second asks the learner to trace the energy path. Both passes use the same visual, but they ask for different kinds of thinking.
Worked example
A solar panel system
Outcome: trace how energy moves from sunlight through the panel, inverter, meter, building, and grid.
Source diagram needs
- Clear, separated components
- Visible direction of energy flow
- Room beside small parts for markers
Solar panel
Explain: Info hotspot
Practice: Click region
Learner can locate where light becomes electric current
Inverter
Explain: Info hotspot
Practice: Label image
Learner can name the part that converts the current
Meter and grid
Explain: Guided tour
Practice: Sequence regions
Learner can trace the flow from panel to building and grid
Do not reveal every answer in persistent labels and then grade recall on the same screen. Either hide the answer labels for practice or change the question so it asks learners to apply the relationships.
Preview the complete learner path
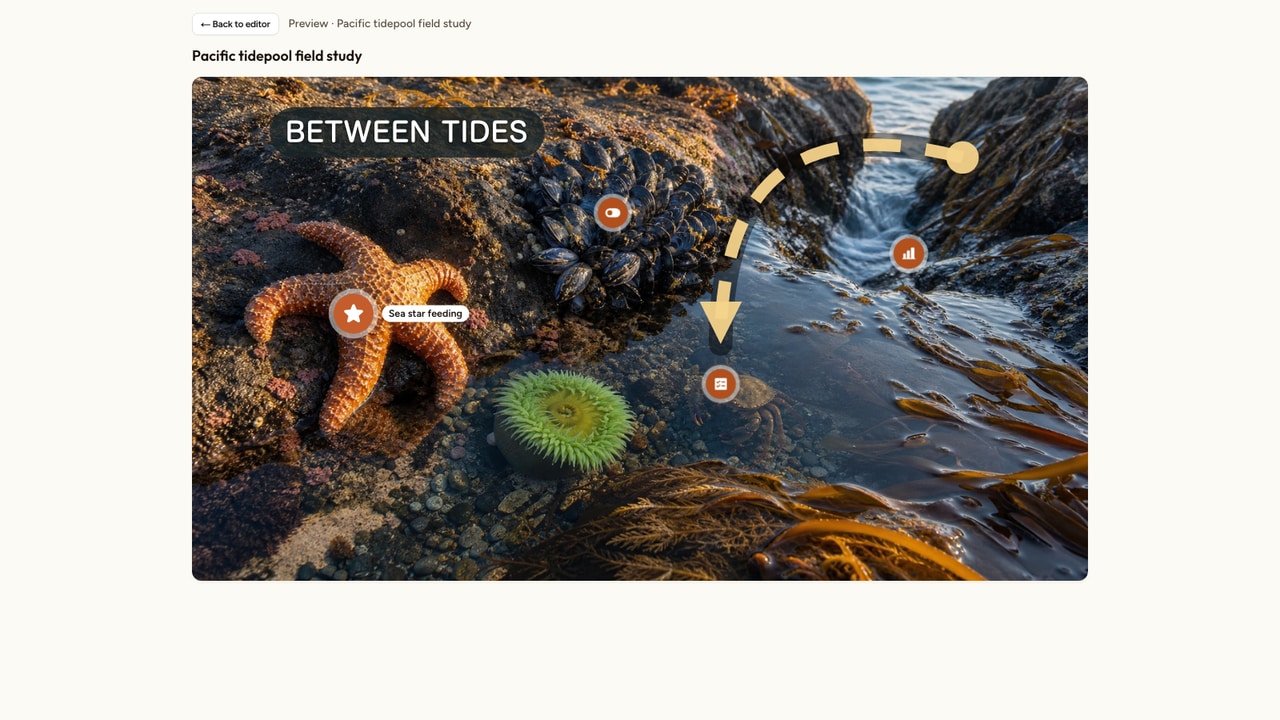
Preview from the first interaction to the last. Test the teaching layer, every answer, feedback, close action, and revisit path. Then check phone playback. Interakly scales the diagram and its image-relative elements together, but crowded authoring can still produce crowded playback.
The source image stays readable before any marker opens
Every marker label predicts the action or content
Interactive regions match the visible part they assess
Feedback explains the relationship, not just correctness
Keyboard order follows the diagram's logical reading path
A complete text explanation carries the same essential meaning
Phone preview keeps markers, labels, cards, and controls usable
Every link, close action, answer path, and return path works
Publish, share, or embed
Publish when the learner path is complete. You can share the direct learner link or copy the chromeless embed code for websites and learning platforms that accept iframe embeds. Use the direct link when the destination blocks iframe content.
If public discoverability matters, use a meaningful title, a complete image description, and at least one useful interaction. Publishing alone does not guarantee search indexing or visibility.
When SVG or custom code is a better fit
Use an SVG or custom application when the visual must recalculate data, animate live values, support freeform zoom and pan, expose hundreds of programmatic objects, or connect to a real-time system. Use a static labeled diagram when the labels already communicate everything and no learner action adds value.
Use an Interakly interactive image when the source is stable and the value comes from explanation, identification, practice, reflection, or a guided route through visible parts.
Troubleshooting checklist
- Markers hide important parts: move them to a nearby edge, add a connector, or reduce the visual treatment.
- People miss the markers: add a specific label, use a clearer icon, or improve contrast without relying on color alone.
- The task feels too easy: remove answer labels during practice or ask for a relationship instead of a name.
- The phone view feels crowded: reduce the number of simultaneous markers and shorten labels while preserving the same learning outcome.
- The diagram needs live behavior: choose an SVG or custom application rather than forcing an image activity to act like a simulation.
FAQ
Can a JPG or PNG become an interactive diagram?
Yes. Interakly accepts PNG, JPG, WebP, and GIF image files up to 5 MB. The diagram becomes the canvas, and the interactive elements sit in image-relative positions on top of it.
Do I need coding skills to make an interactive diagram?
No. You can upload the diagram, place markers or regions, choose an activity, write the content and feedback, then preview the learner experience without writing code.
What is the difference between an interactive diagram and a flowchart?
A flowchart shows a process or decision structure. An interactive diagram adds viewer actions to a visual, such as revealing an explanation, identifying a region, labeling a part, comparing areas, or selecting stages in order.
Which diagram interactions work best for teaching?
Use Info hotspot for explanations, Label image for terminology, Click region or Find all for identification, Sequence regions for ordered processes, Compare regions for contrasts, and Guided tour for a planned walkthrough.
Can an interactive diagram grade answers?
Objective questions and configured spatial activities can be graded automatically. Polls and rating scales collect responses rather than scores. Free responses can use keyword grading or wait for educator review.
Can I embed an interactive diagram in a website or LMS?
You can use Interakly's embed code in websites and learning platforms that accept iframe embeds. The direct learner link is the simpler choice when the destination does not accept iframes.
How does an interactive diagram work on a phone?
In learner playback, the diagram and its image-relative elements scale together. Preview the finished experience at phone width to check marker spacing, labels, reading order, and every opened card.
How can screen reader users understand a complex diagram?
Provide a short image description for identification and a complete text explanation of the relationships or data the diagram communicates. Give every interactive control a specific accessible name and keep its keyboard order logical.
Choose an interactive image example
Compare practical patterns for diagrams, equipment, maps, software, safety tasks, products, and visual journeys.
Build an interactive anatomy diagram
Apply verified sources, explicit orientation, defensible regions, labeling practice, structured alternatives, and subject review to anatomy learning.
Follow the complete interactive image workflow
Use the general image guide for creation, activity setup, preview, publishing, sharing, and embedding.
Plan the wider visual learning strategy
Learn when diagrams, maps, photographs, timelines, and interactive images help people understand a subject.
Make one diagram teach one clear idea
Start with a readable source, choose one learner action, then test the complete path before adding another activity.
Create an interactive imageSee the current image workflow and activity catalogue on the interactive images product page.