Interactive-Video Completion Rate: A Careful Guide
Define sessions, completion triggers, cohorts, and comparison windows before using interactive-video completion rate to guide a lesson revision.
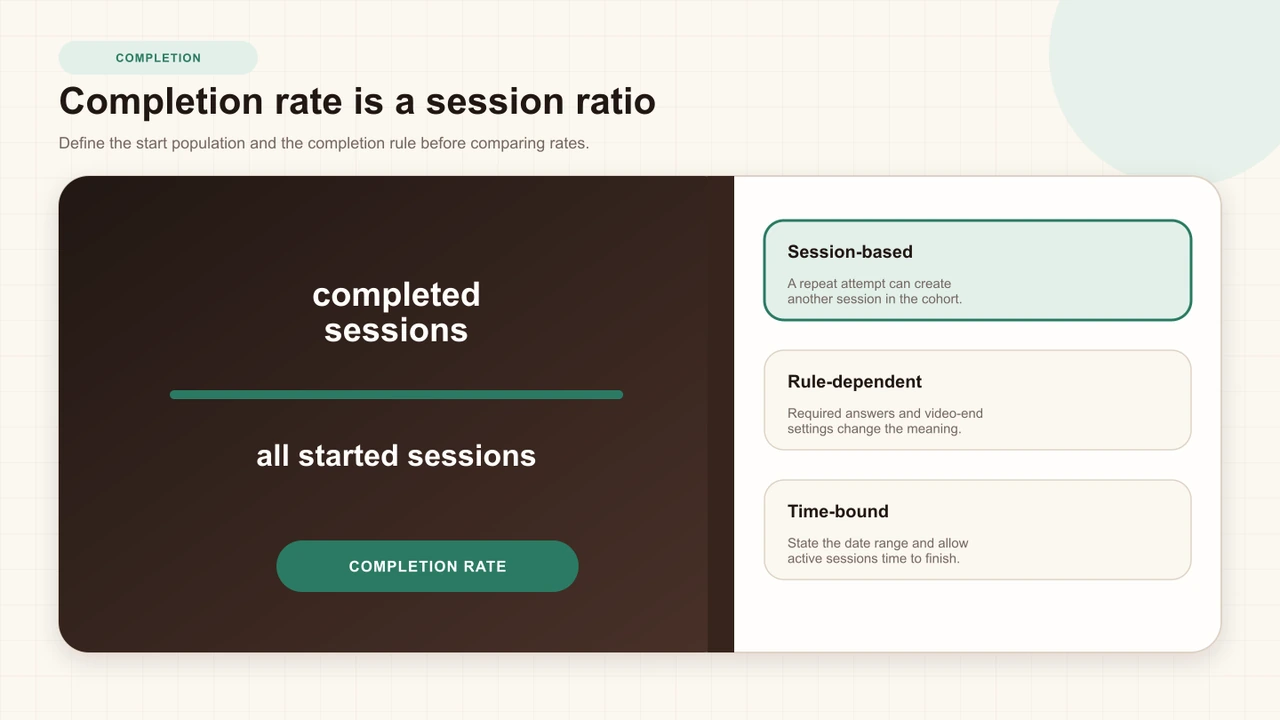
Interactive-video completion rate looks simple: completed sessions divided by sessions. The difficult work sits inside those two words. What condition counts as complete? Which sessions are eligible? Are repeats included? Did the audience, assignment, source, or lesson version change during the period? Without those definitions, a precise percentage can support a very imprecise story.
Use completion as a behavioral signal about a configured journey. Pair it with question evidence, score, learner context, technical checks, and qualitative feedback before deciding what to revise. This guide shows how to make that interpretation explicit and proportionate.
Completion needs a definition
Write the completion event in a sentence before reading the rate. A linear lesson may count completion when the learner reaches the end. An interaction-led lesson may require every required prompt to be answered. Another implementation may use whichever condition occurs first. These rules describe different behavior even if the dashboard label is the same.
The xAPI specification deliberately separates completion, success, and score. That is a useful mental model even when a product does not expose those exact fields. “Completed” means the activity's completion condition was reached. “Successful” refers to a success rule. “Score” records a result. Conflating them can turn a watched-to-the-end session into a claim of mastery.
Read the session denominator
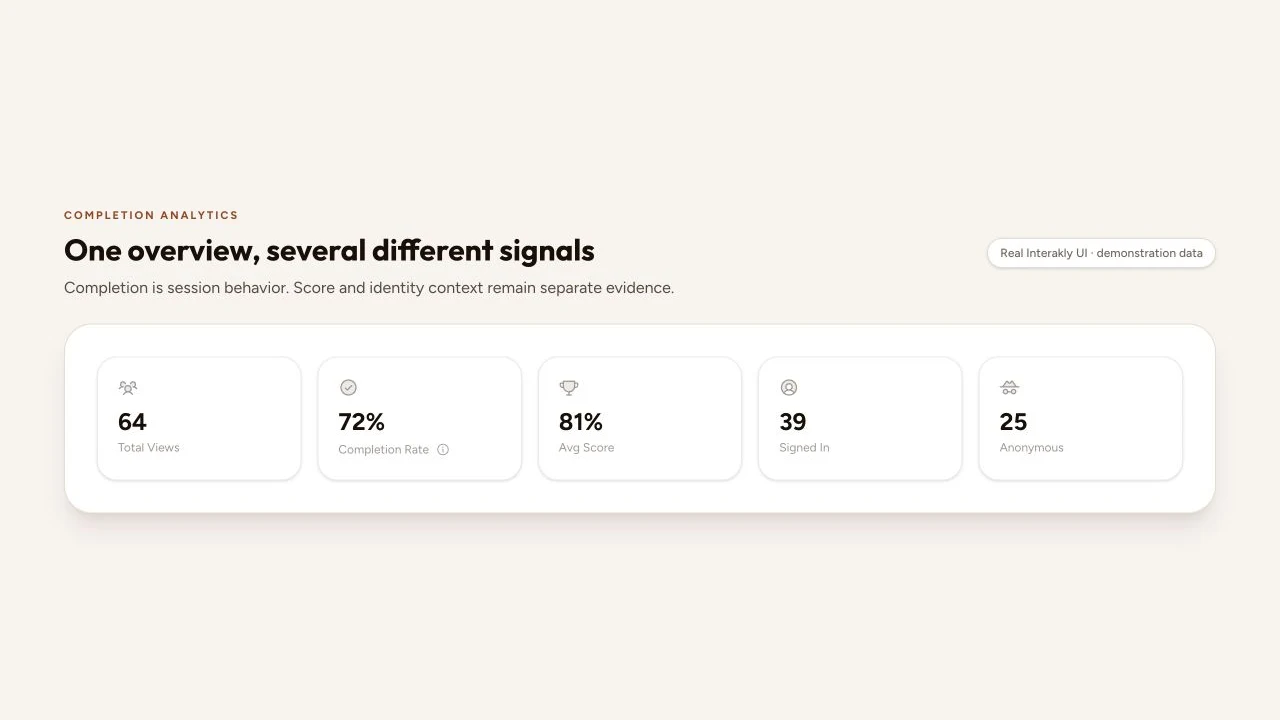
Interakly's total views and completion rate are session-based. A person can produce multiple sessions through retakes, restarts, devices, or shared links. Anonymous sessions remain sessions; they should not be silently relabeled as unique learners. State the unit honestly in reports and avoid multiplying a session count into a people claim.
Confirm which sessions are eligible. A preview by the author, a short technical open, an abandoned first load, and a full learner attempt may all have different meaning. If the product includes them in the standard metric, keep that fact visible and use a separate, documented analysis for any narrower evaluation question.
Ambiguous claim
Seventy-two percent of learners finished the training.
Defined observation
Forty-six of 64 recorded sessions met this project's completion rule during the selected period.
Keep completion separate from success
A learner can complete with a low score, leave before completion after answering every question correctly, or replay a completed lesson to practice. Those are coherent behaviors. Treating completion as a proxy for every desirable outcome hides the very cases an instructional team needs to understand.
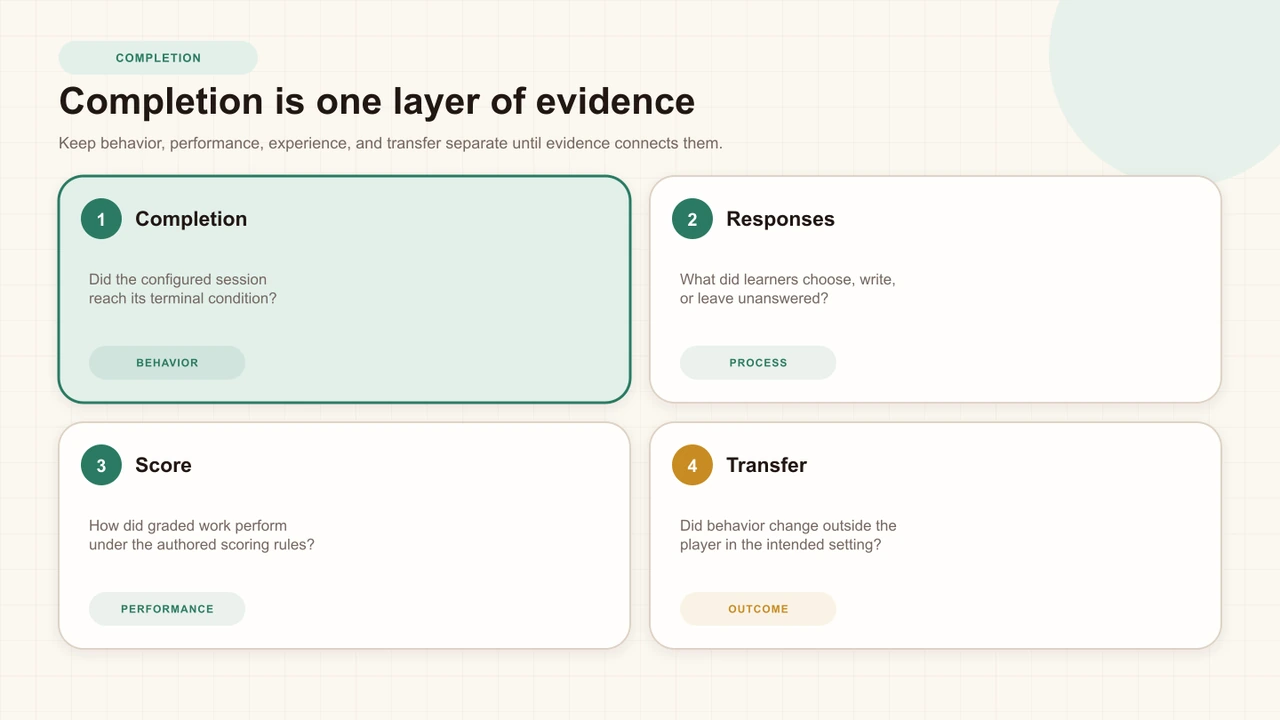
- Completion: did the session reach the configured boundary?
- Score: what result did the evaluated responses produce?
- Question evidence: where did response patterns suggest review?
- Transfer evidence: did later performance change in the relevant setting?
A useful review can therefore find a stable completion rate but a weak response pattern, or a lower completion rate paired with strong first- attempt performance. The conclusion depends on the instructional purpose. A voluntary reference video and a mandatory certification checkpoint do not share the same definition of success.
Choose a useful comparison window
Lifetime averages are easy to display and hard to act on. Choose a window that matches the decision: one onboarding cohort, the four weeks after a revision, or the current semester. Preserve a pre-change baseline when a new prompt, source, or completion rule ships.
Avoid interpreting very short windows with only a few sessions. A change from 50 percent to 75 percent sounds large when it represents two of four sessions versus three of four. NIST's guidance on proportions explains why uncertainty narrows with more observations. You do not need a confidence interval in every creator dashboard, but you do need the count and a proportionate tone.
Compare cohorts without overreaching
Cohort comparisons become useful when the groups correspond to a real instructional difference: new hires versus experienced staff, assigned versus optional use, or pre-revision versus post-revision learners. Keep the rule, period, source, and assignment context as similar as possible.
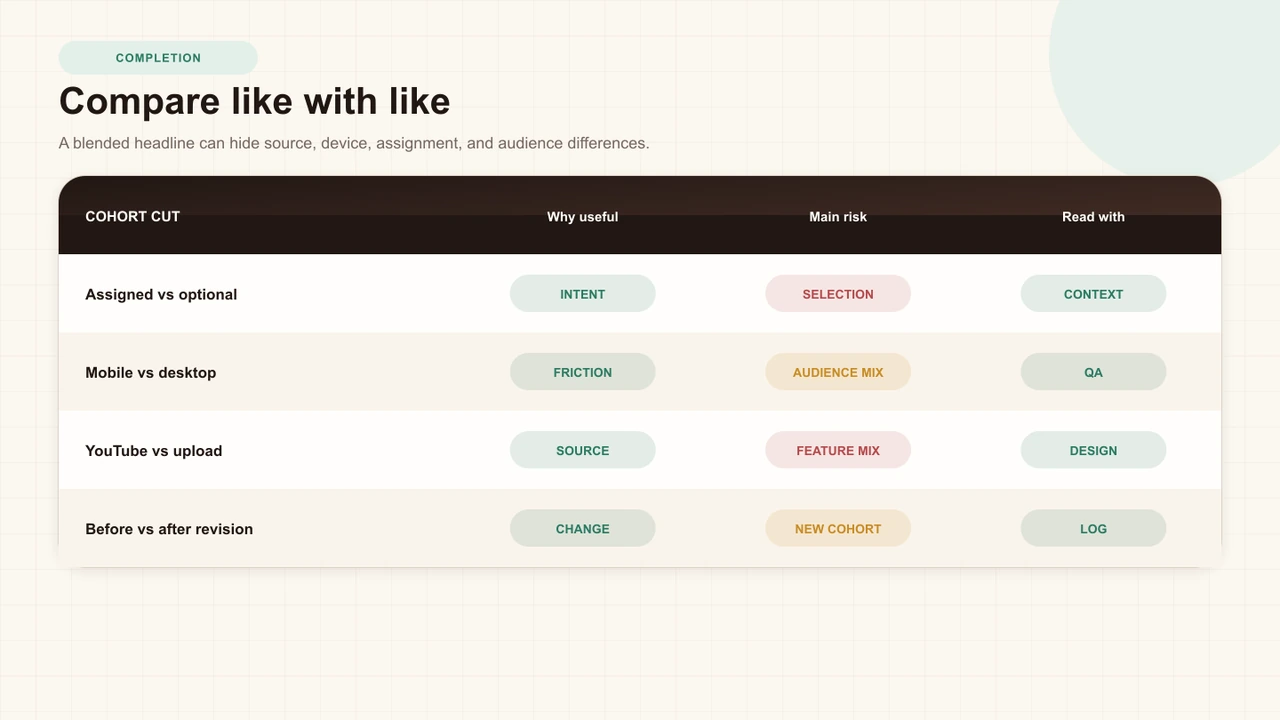
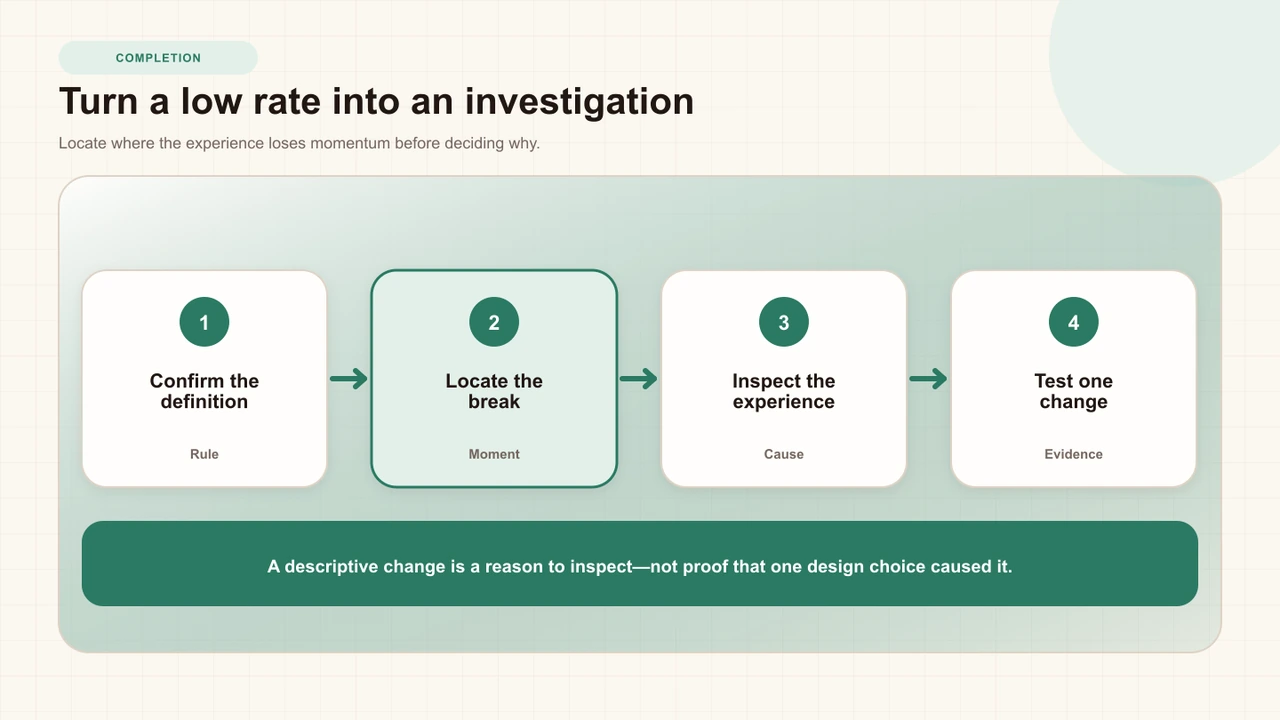
A difference between cohorts is descriptive. It does not prove that the cohort label caused the difference. Prior knowledge, manager support, device access, time available, assignment incentives, and technical conditions may all vary. The EDUCAUSE discussion of MOOC retention and intention is especially relevant: leaving an optional experience does not always mean failure when learner intentions differ.
Investigate the learner journey
Completion tells you whether a boundary was reached, not where or why a session stopped. Inspect the complete learner route: opening conditions, media playback, each blocking interaction, feedback, branch transitions, resume behavior, mobile layout, source availability, and the ending. Test the published destination rather than assuming the editor preview proves the route.
Ask a few learners to narrate what they expected at the point they left or hesitated. A confusing submit state, a question that appears after the perceived ending, a hidden continue action, or an LMS embed constraint can all reduce completion without saying anything about motivation or content quality.
Combine completion with other signals
Triangulation means using evidence with different weaknesses. Completion gives a boundary state. Question analytics show recorded response patterns. A watch-activity heatmap locates moments with relatively more or less sampling. Support tickets, interviews, and observation add explanations the event stream cannot contain.
Look for convergence rather than forcing alignment. A fall in completion, a technical error cluster, and learner reports of a stuck prompt form a stronger operational case than the completion change alone. A completion change with stable product behavior and a new optional audience may need no corrective redesign.
How to Read Video Question Analytics
Interpret response denominators, graded correctness, distractor patterns, and technical recovery as separate evidence.
How to Read Video Engagement Heatmaps
Use relative watch-progress activity to locate moments for inspection without claiming it reveals intent.
Test one bounded change
When the evidence supports a plausible design problem, change one coherent part of the journey. Move an interaction that interrupts an explanation, rewrite a confusing continue action, repair a source failure, or clarify the completion boundary. Record the version and deployment date.
Define
Write the completion rule, eligible session unit, period, and learner context.
Verify
Check that the rule and instrumentation behaved as expected in the published lesson.
Triangulate
Review response, watch-activity, technical, and qualitative evidence around the journey.
Change and compare
Ship one documented improvement and analyze fresh sessions separately from the baseline.
Report uncertainty and limitations
A responsible summary includes the count, rate, completion rule, date range, version, source type, population, known exclusions, and whether sessions can repeat. It names data quality issues and avoids decimals that imply more precision than the evidence supports.
If a team presents a statistical comparison, follow a pre-specified method and report effect size, uncertainty, study limitations, and all relevant analyses—not only whether a threshold was crossed. The ASA statement on p-values is a useful guardrail: a single number does not measure the size or importance of an effect and cannot turn an observational dashboard into an experiment.
Interakly product boundaries
In Interakly, the analytics overview reports total-view sessions, completion rate, average score, and signed-in and anonymous session context as separate cards. A project may be configured to count completion when required interactions are answered or when the video end is reached, depending on its completion trigger. Read that definition before using the percentage elsewhere.
Supported uploaded-video and YouTube lessons can both produce session evidence, while their media control and interaction capabilities differ. Interakly does not claim that a completed session represents a unique person, proves attention, or caused learning. Exported and dashboard data still require the interpretation boundaries described in this guide.
A practical completion review
- Write the exact completion trigger in plain language.
- Record completed and eligible session counts, not only the rate.
- Choose a decision-relevant period and preserve the previous baseline.
- Separate score, question evidence, identity context, and technical events.
- Walk the published route on desktop, phone, and the actual embed destination.
- Interview or observe a small learner sample around the suspected friction.
- Ship one bounded change and compare fresh sessions with a documented caveat.
Sources and further reading
- ADL: Experience API Specification 1.0.1 — separate completion, success, and score concepts.
- 1EdTech: Caliper Analytics — event and metric-profile context for learning data.
- 1EdTech: Caliper Metric Profiles Common Explanations — practical distinctions among event families.
- EDUCAUSE: Retention and Intention in MOOCs — why learner intention changes the meaning of completion.
- Jisc: Code of Practice for Learning Analytics — responsible collection, interpretation, and intervention.
- NIST: Confidence Limits for a Proportion — sample-size context for rate comparisons.
- American Statistical Association: Statement on P-Values — limits on numerical and causal claims.
FAQ
What is interactive-video completion rate?
It is completed sessions divided by eligible sessions for a defined video, period, and completion rule. The rule and denominator must travel with the percentage.
Is a completed session the same as a unique learner?
No. A learner may create more than one session, and anonymous activity may not map reliably to a person. Use the product's session unit unless a separate identity analysis is explicitly justified.
Does a high completion rate prove learning?
No. Completion records that the configured session condition was reached. It does not prove understanding, score quality, transfer, satisfaction, or causal impact.
What is a good video completion rate?
There is no universal benchmark. A useful baseline comes from comparable lessons, audiences, assignment conditions, duration, and completion rules inside your own context.
Should I exclude anonymous sessions?
Not automatically. First decide whether the evaluation question concerns all viewing sessions or a known learner cohort. Report inclusion rules and compare signed-in and anonymous context separately when it matters.
How should I respond to a completion-rate drop?
Check definition changes, dates, cohort mix, source delivery, and session volume first. Then inspect the journey near the relevant moments and test one plausible improvement instead of redesigning the whole lesson.
Interactive Video Best Practices
Connect completion with learning outcomes, interaction timing, feedback, mobile quality, and evidence planning.
Define the rate before debating it
Write the session unit, completion rule, period, and learner context beside the next percentage your team reviews.
Explore video interactions