Video Question Analytics: Read Results Without Guessing
Interpret response counts, correct rates, distractor patterns, and technical recovery without turning descriptive video-question data into causal claims.
Video question analytics are most useful when they make a teaching decision more precise. A response count tells you how much evidence is present. A correct rate describes graded attempts. A distribution shows which options were recorded. None of those numbers explains why a learner chose an answer, and none proves that the video caused learning.
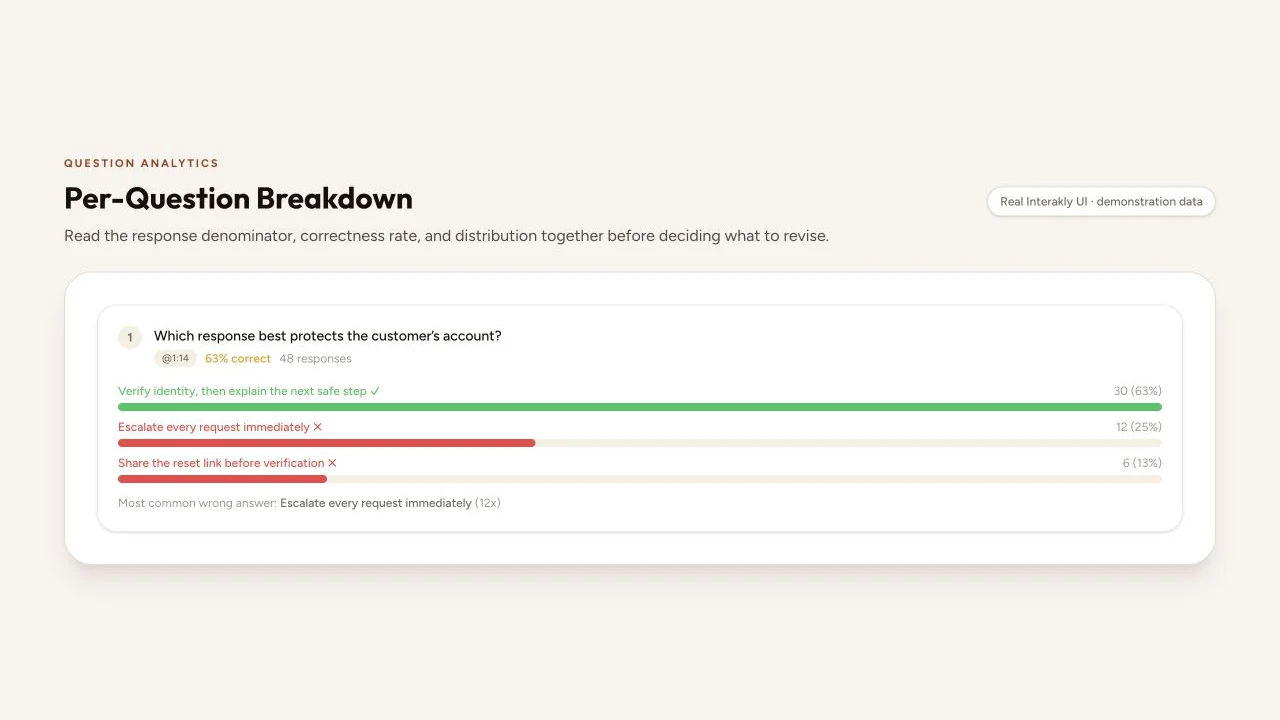
This guide uses Interakly's current per-question results as a concrete model, then builds an interpretation workflow around them. The goal is not to admire a dashboard. It is to move from a visible pattern to a cautious hypothesis, a bounded revision, and a better next round of evidence.
What question analytics can answer
Descriptive question analytics can answer four practical questions. How many responses were recorded? What share of graded attempts met the answer rule? Which labels or options were selected? Which incorrect option was most frequent? These are observations about the collected attempts, not explanations of learner thinking.
Use them to locate a review target. A low correct rate can justify opening the prompt and source moment. A concentrated wrong option can justify a language or content check. An even distribution can justify checking whether all options sound equally defensible. The data narrows where to look; the lesson, assessment design, and learner context determine what you find there.
Start with the response denominator
Read every percentage with its denominator. In Interakly, a question card shows total recorded responses beside the percentage. For graded formats, the correct rate uses graded attempts as its denominator. A technical source-unavailable recovery is reported separately rather than silently becoming a wrong learner answer.
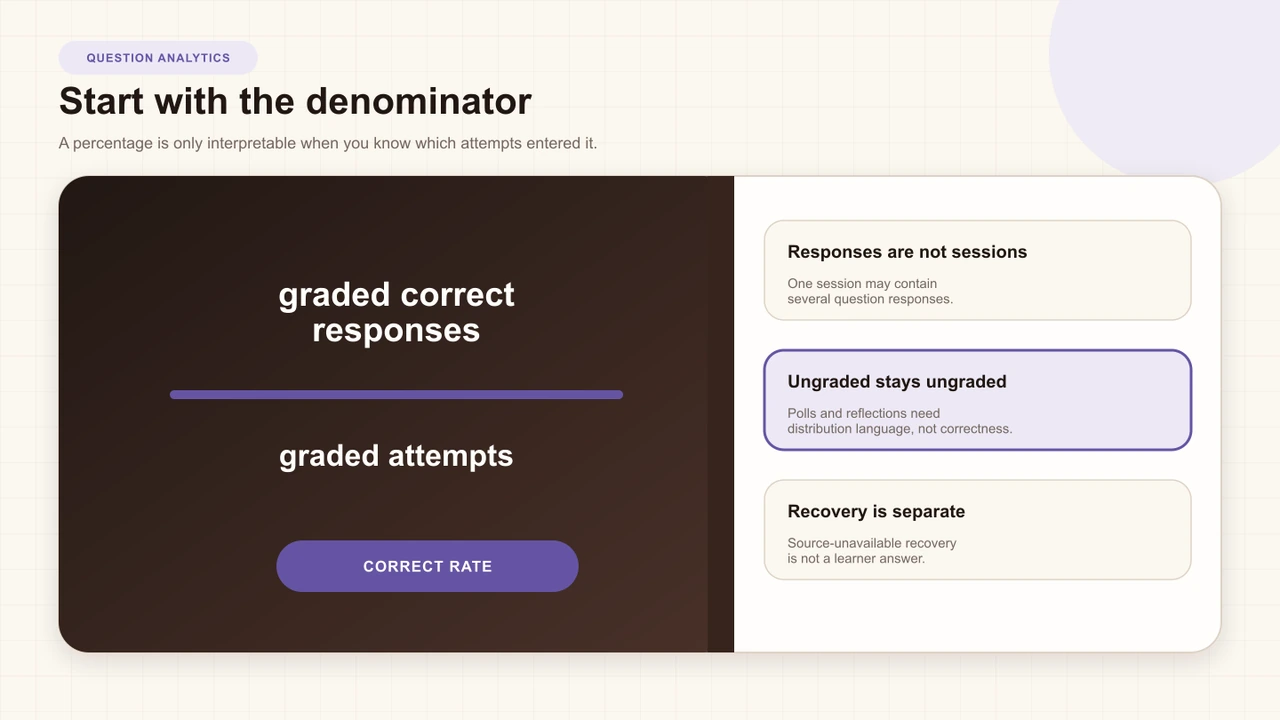
Counts matter because 63 percent of 48 graded attempts is a different evidence situation from 63 percent of eight. Repeated attempts also mean sessions are not necessarily unique people. If the learning question is about first-attempt understanding, separate or label retakes rather than averaging them into a single story.
Date range and population matter too. A support-team cohort may have a different baseline from new hires. A recently edited question may mix two versions unless the comparison is bounded. Write the denominator, period, learner context, and attempt policy beside any number you carry into a report or design review.
Separate correctness from response choice
Correctness and response distribution answer different questions. A multiple-choice knowledge check may have an answer key, so the correct rate is meaningful within that rule. A poll records preference or opinion; its distribution can be meaningful while a correct rate would be false. An open response may be evaluated through keywords or human review, which requires yet another interpretation.
Misleading summary
Most learners got 63%, so the video worked.
Defensible description
Thirty of 48 graded attempts met this question’s answer rule; review the item and source context before explaining why.
Correctness also depends on the authored key. If an expected answer is wrong, incomplete, or more context-dependent than the author realized, the dashboard will faithfully summarize a faulty rule. Read a low or surprisingly high rate as a prompt to validate the question itself before judging the learners.
Read distractor patterns carefully
A distractor is an incorrect option designed to be plausible to someone who has not yet mastered the target distinction. When one wrong option is chosen repeatedly, it may reflect a predictable misconception. It may also reflect ambiguous language, an accidental clue in the correct option, a cue from the video, or an answer that is defensible under another policy.
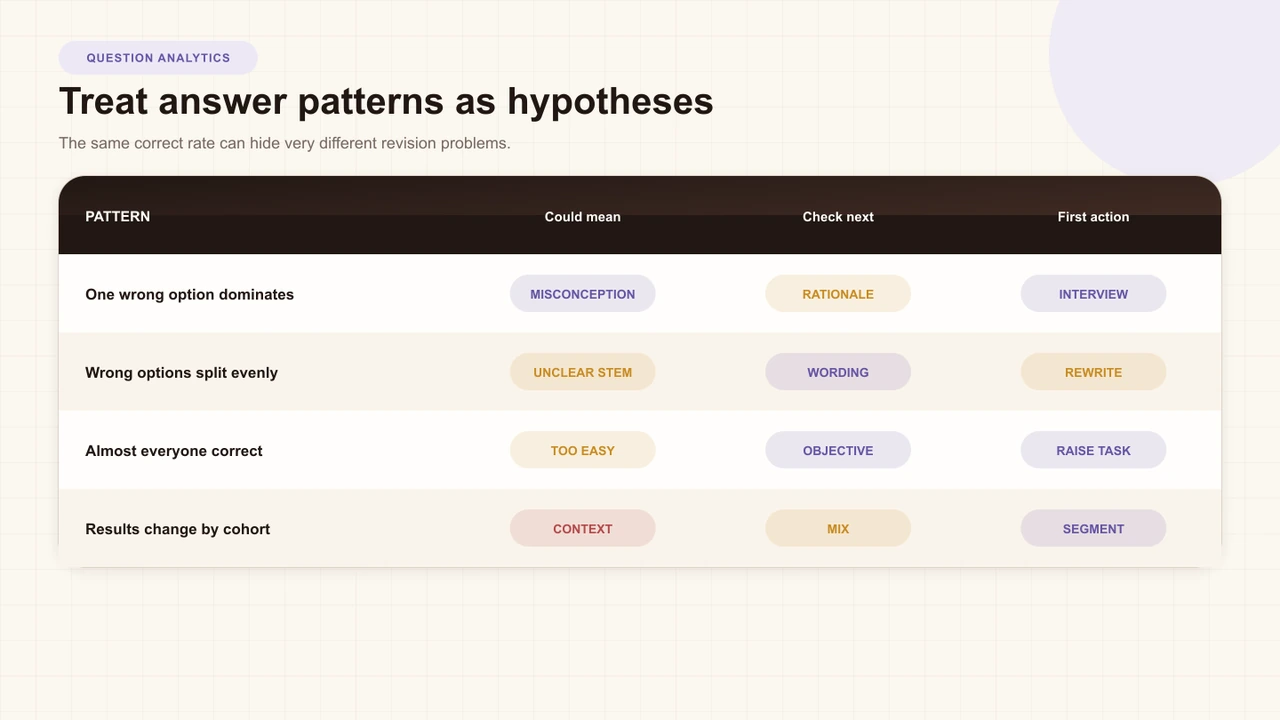
- One dominant wrong option: inspect the distinction that option represents and interview a few learners.
- Wrong answers split evenly: check whether the prompt is underspecified or the lesson never made the boundary explicit.
- One option never selected: it may be implausible, grammatically mismatched, or outside the learner's real decision set.
- Almost everyone correct: the item may confirm a core prerequisite, or it may be too cued to discriminate understanding.
How to Write Plausible Multiple-Choice Distractors
Design options at the same conceptual altitude, remove clues, and connect each wrong choice to useful feedback.
Compare questions before conclusions
A single item is noisy. Compare related questions that target the same concept through different wording or contexts. If all of them show the same difficulty, the lesson or prerequisite may deserve attention. If one item is an outlier, inspect its wording, placement, answer key, and interaction type first.
Avoid ranking questions by correct rate alone. Later questions may have a selected population because some learners left earlier. Retakes may be more common on a high-stakes checkpoint. An open response evaluated with a keyword rule should not be treated as psychometrically interchangeable with a carefully constructed multiple-choice item.
Segment context before revision
Useful segments follow the instructional question. Compare first attempts with retakes when practice is the concern. Compare cohorts when they had different onboarding or prerequisites. Compare pre-revision with post-revision attempts when an item changed. Do not create many small slices merely because the dashboard can be filtered.
Small groups create unstable percentages and privacy risk. Keep the count visible, avoid reporting individual-level conclusions from sparse cells, and aggregate when a slice could identify a learner. Jisc's learning analytics code emphasizes transparency, validity, access, and responsible intervention; those principles belong in ordinary content review too.
Turn patterns into hypotheses
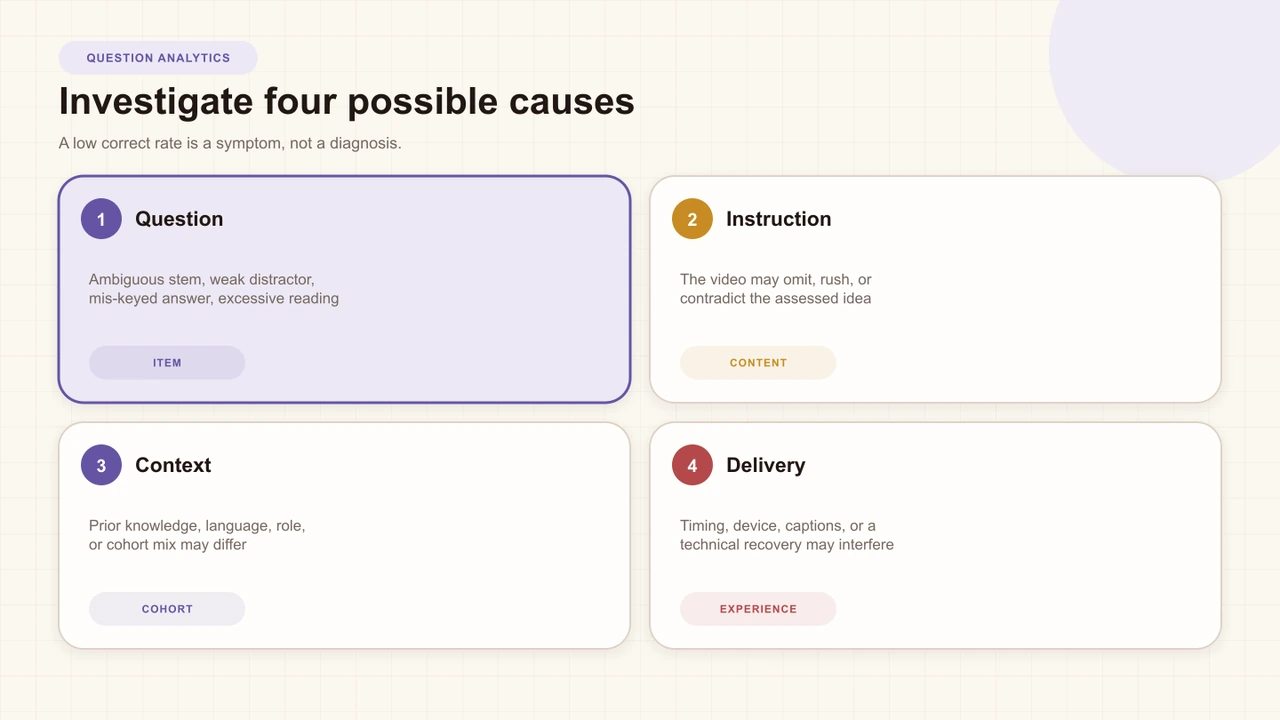
Good interpretation uses conditional language. “Learners misunderstood identity verification” is a conclusion. “The concentrated choice may indicate that the distinction between urgency and verification was not clear” is a hypothesis that can be checked against the prompt, video, feedback, and learner explanation.
Describe
Write the count, rate, distribution, date range, and population without interpretation.
Generate alternatives
List at least one learning explanation and one item-design or delivery explanation.
Inspect
Replay the source moment, cold-read the question, verify the key, and sample learner reasoning.
Decide
Choose the smallest revision that distinguishes the most important competing explanations.
Test a revision
Change one meaningful element when possible: the prompt, one distractor, the explanatory segment, or the feedback. Record what changed and when. Then compare a new cohort or later attempts under the revised version, while acknowledging that time and population may still differ.
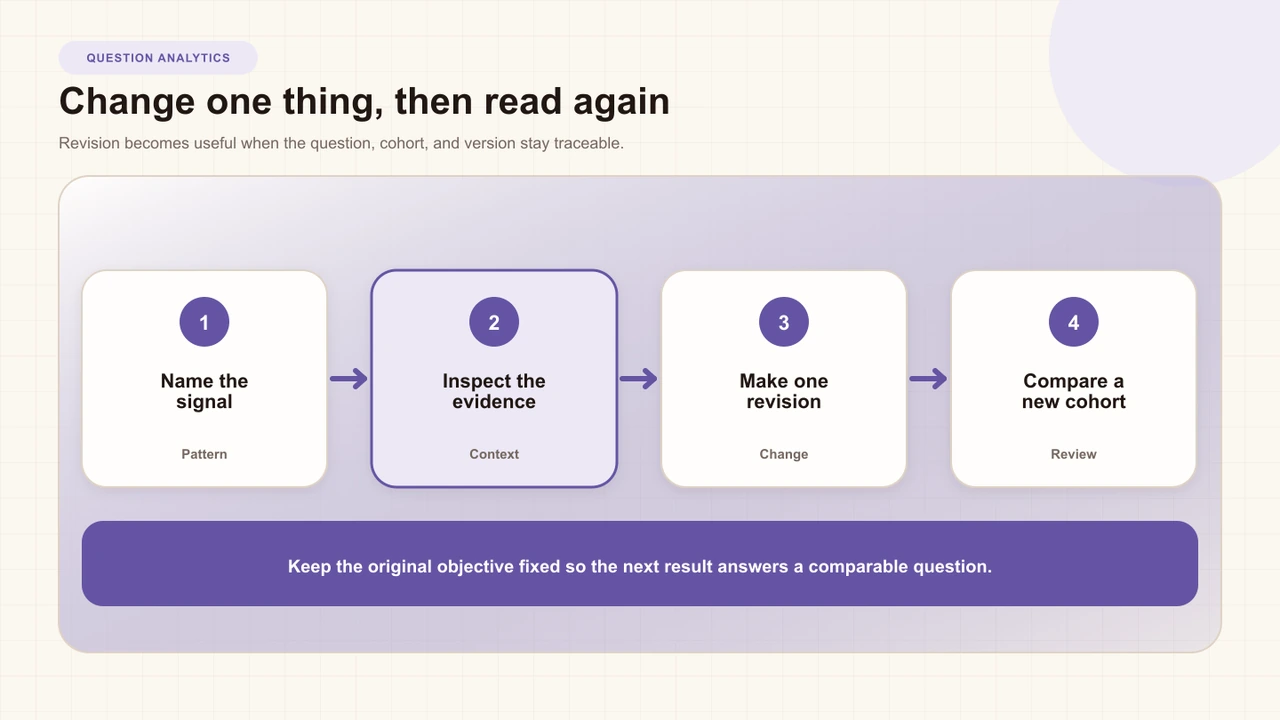
Do not erase the old evidence by changing several things and combining all attempts into one lifetime rate. A lightweight revision log—version, hypothesis, change, date, cohort, and result—makes the dashboard useful to the next author instead of turning it into an undocumented score chase.
Protect privacy and fairness
Question analytics can expose sensitive performance patterns. Limit access to people with a legitimate instructional role, explain what data is collected, retain it for a defined purpose, and avoid naming individual learners in a design critique. Anonymous sessions are still behavioral records, not permission to infer identity or intent.
Fairness also requires reviewing whether language, cultural assumptions, accessibility barriers, or technical source failures affect the response. A technical recovery should not become an incorrect answer. A spatial task that some learners cannot operate should not be interpreted as missing subject knowledge. Use the Standard for Educational and Psychological Testing as a reminder that validity and fairness concern the interpretation and use of scores, not only the item format.
Interakly product boundaries
Interakly's current analytics show recorded response counts, distributions, correct rates for graded questions, most-common-wrong clues, and separate technical-unavailable recovery. Less-common distribution labels may be omitted from the visible list when a result set is large, so the summary is not a promise that every label is displayed at once.
The same interpretation discipline applies to supported uploaded-video and YouTube lessons, although interaction availability and source behavior differ. The product reports session and response evidence; it does not infer misconception, attention, motivation, or causal learning impact.
A practical weekly workflow
- Choose one lesson and a stable date range.
- Record response counts before sorting by percentage.
- Separate graded questions, polls, and open responses.
- Flag one pattern with enough evidence to inspect.
- Replay the source and cold-read the item with a colleague.
- Write two plausible explanations and one validation check.
- Make one bounded revision, preserve the baseline, and review again.
How to Interpret Interactive-Video Completion Rate
Define completion, sessions, cohorts, and comparison windows before reading the headline percentage.
How to Read Video Engagement Heatmaps
Use watch-progress patterns to choose moments for investigation without inventing learner intent.
Sources and further reading
- Standards for Educational and Psychological Testing — validity, reliability, fairness, and responsible score interpretation.
- ETS: Distractor Analysis of Multiple-Choice Items — research on interpreting option behavior.
- ETS: Foundations of Operational Item Analysis — practical foundations for item statistics.
- IES: Using Student Achievement Data to Support Instructional Decision Making — a structured data-use cycle.
- Jisc: Code of Practice for Learning Analytics — transparency, validity, access, and responsible action.
- NIST: Confidence Limits for a Proportion — why sample size belongs beside percentages.
- American Statistical Association: Statement on Statistical Significance and P-Values — guardrails against overstating numerical evidence.
FAQ
What does a video-question correct rate measure?
It measures the share of graded attempts that were evaluated as correct for that question in the selected data. It does not by itself measure durable learning, transfer, or the effect of the video.
Should ungraded polls have a correct rate?
No. A poll can have a useful response distribution without a correct answer. Giving it a correctness percentage would invent a judgment the activity was not designed to make.
Does the most common wrong answer reveal a misconception?
It is a clue, not proof. The option may represent a misconception, ambiguous wording, a visual clue, random guessing, or a reasonable interpretation the author did not anticipate.
How many responses are enough to revise a question?
There is no universal cutoff. Show the count, consider how representative the learners and attempts are, and treat small groups as unstable. A recurring pattern across cohorts is stronger evidence than one early result.
Can question analytics prove that a lesson caused improvement?
No. Descriptive analytics can locate patterns worth investigating. A causal claim needs a study design that addresses comparison, selection, prior knowledge, exposure, and other plausible explanations.
What should I change first when a question performs poorly?
Inspect the prompt, expected answer, distractors, source moment, feedback, and technical delivery before changing the lesson. Then make one bounded revision and compare new attempts separately from the old version.
Interactive Video Best Practices
Connect question analytics to clear outcomes, purposeful timing, feedback, accessibility, and publishing quality.
Turn one pattern into a testable question
Open a question with enough responses, write the denominator, name two possible explanations, and choose one bounded revision to validate.
Explore video interactions