How to Evaluate Interactive Video ROI Honestly
Evaluate interactive video costs, benefits, feasibility, learning evidence, uncertainty, and alternatives without turning activity metrics into invented ROI.
Interactive video ROI is often presented backward. A percentage appears first, followed by a story assembled from completion, satisfaction, time saved, or error reduction. An honest evaluation starts with the decision, names the alternatives, records the resources consumed, defines the intended outcomes, and asks what evidence can support each link. Only then does it choose an economic method.
This guide is not a promise that interactive video produces a financial return. It is a method for deciding whether a specific program, in a specific context, is feasible, cost-effective, beneficial, or worth further investment. A useful analysis can conclude that the evidence is insufficient, that an alternative is better, or that important value should remain non-monetized.
Define the decision before the formula
State the exact choice: continue the current approach, improve it, adopt an interactive-video workflow for one program, expand a successful pilot, or replace another format. Name the decision owner, learner population, intended outcome, time horizon, constraints, and next review date. A calculation without an alternative cannot tell a decision maker which option is preferable.
HM Treasury's 2026 Green Book defines appraisal as assessing the costs, benefits, and risks of different options for achieving objectives. It also warns that a benefit-cost ratio alone is not the decision: unmonetized value, distribution, financial impact, risk, uncertainty, and whether the option meets the objective all matter. The framework is designed for public decisions, but its insistence on options and transparent uncertainty is valuable in any learning-technology case.
Choose the right economic question
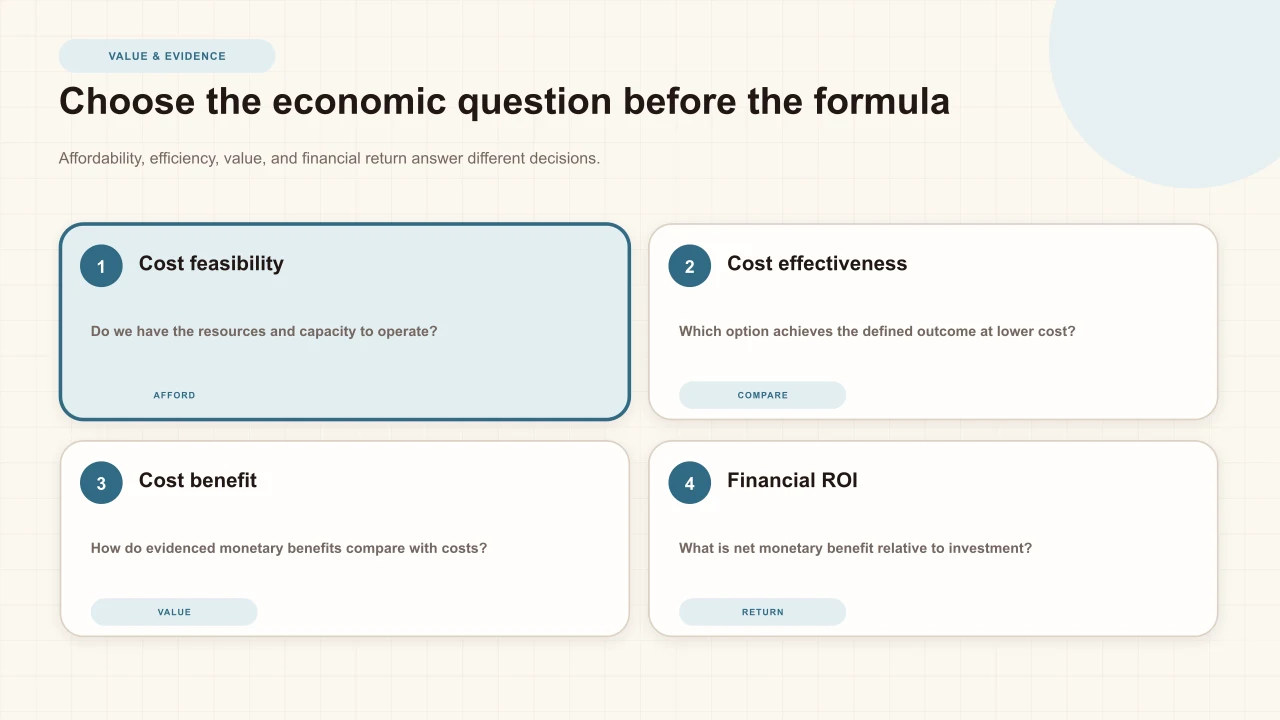
Cost-feasibility asks whether the organization has the people, time, systems, and budget to implement the program. Cost-effectiveness compares the cost of achieving a common outcome across alternatives. Cost-benefit analysis expresses costs and benefits in monetary terms. A financial ROI focuses on monetary net benefit relative to investment. These methods answer different questions and should not be used as interchangeable labels.
The IES Cost Analysis Starter Kit describes cost analysis as a foundation for cost-feasibility, cost-effectiveness, and cost-benefit work. Begin there. If the organization cannot estimate the ingredients required to operate the program, it is not ready to make a defensible return claim. If outcomes differ in kind or cannot be credibly monetized, a cost-effectiveness comparison or structured appraisal may be more informative.
Set the baseline and alternatives
Document business as usual: how content is produced, how learners practice, how evidence is reviewed, how often material changes, and where support or failure costs occur. Then define realistic alternatives. These may include improving the current video, adding live facilitation, using a static quiz, changing the task, adopting interactive video, or doing nothing for now.
Use the same population, time horizon, price basis, and outcome definition across options. Avoid comparing the full cost of the proposed workflow with only the vendor invoice for the current approach. Also avoid crediting interactive video with outcomes that would occur under every option, such as already scheduled training or a simultaneous policy change.
Biased comparison
New platform license, author time, and support versus the old platform license alone.
Comparable options
All resources, recurring work, risks, and defined outcomes for each realistic alternative over the same period.
Build a complete cost ledger
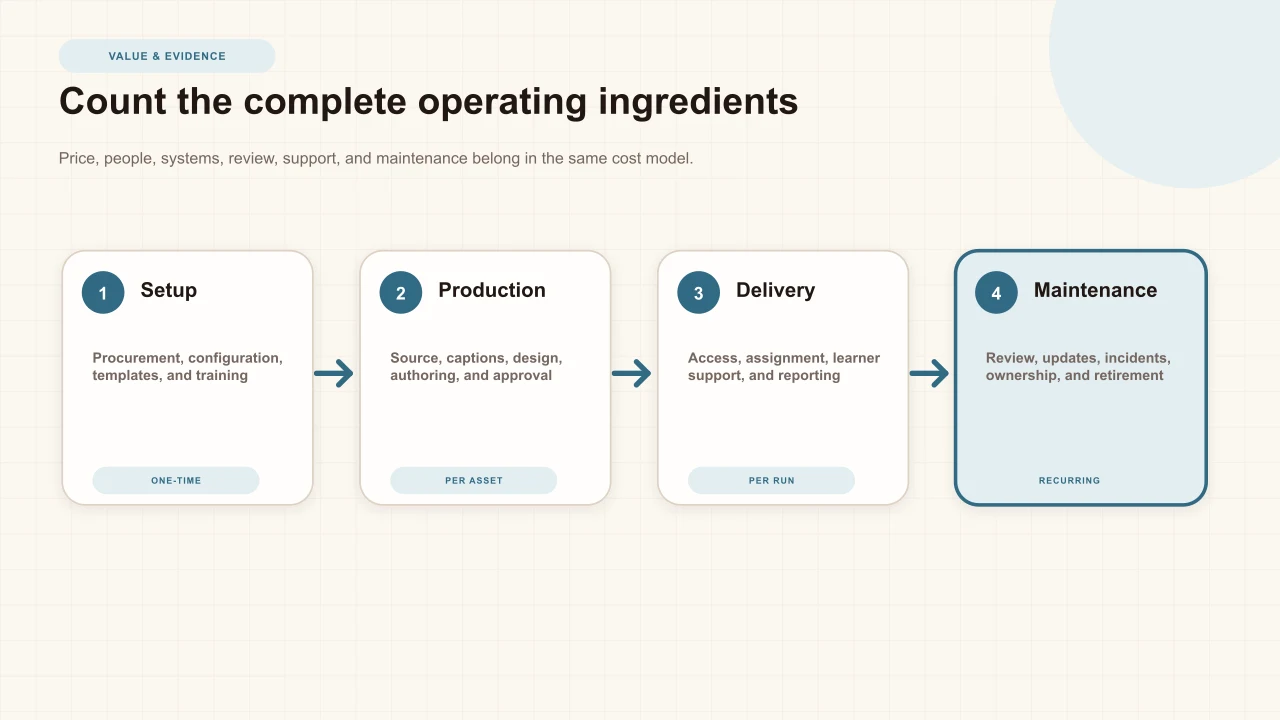
Use an ingredients approach. List personnel, facilities, equipment, services, materials, and other inputs; record quantity and timing; then assign an appropriate price or value. The IES starter kit organizes that work into identifying ingredients, pricing them, creating the estimate, and testing assumptions. This makes the model auditable and easier to update after a pilot.
For interactive video, include product fees, source licensing, recording or upload preparation, caption correction, transcript work, instructional design, interaction authoring, media review, subject-matter review, accessibility tests, privacy and security review, LMS or embed configuration, learner communication, technical support, analytics interpretation, content updates, and retirement. Separate setup from recurring operation and identify shared costs that must be allocated across programs.
Keep time visible
Existing employees still consume scarce time. Track hours for author training, lesson preparation, review, publishing, troubleshooting, reporting, and content maintenance. Decide whether the analysis needs a financial cost, an opportunity cost, or a capacity threshold. At minimum, report the hours by role so a decision maker can see whose workload carries the program.
Avoid using a single author's first lesson as the permanent production rate. Measure several representative tasks and record learning effects, templates, reuse, review cycles, and content complexity. A short true-or-false overlay and a branched scenario with captions, feedback, and multiple reviewers are not the same production unit. Report the mix the rollout is expected to contain.
Define benefits before measuring them
Write each proposed benefit as an outcome with a unit, population, time window, and mechanism. “Reduce average supervised escalation errors among new support agents during their first 30 days” is measurable. “Increase engagement” is too broad. Explain how the interactive activity is expected to contribute and what other conditions—coaching, policy clarity, practice opportunity, manager feedback—must also be present.
Potential benefits may include better task performance, reduced remediation, faster time to a defined proficiency threshold, fewer avoidable support requests, reusable authoring assets, better visibility into misconceptions, or reduced delivery effort. None is automatic. Some are intermediate outcomes, and some may shift costs rather than reduce them. Name who experiences the benefit and who carries the cost.
Match evidence to each benefit
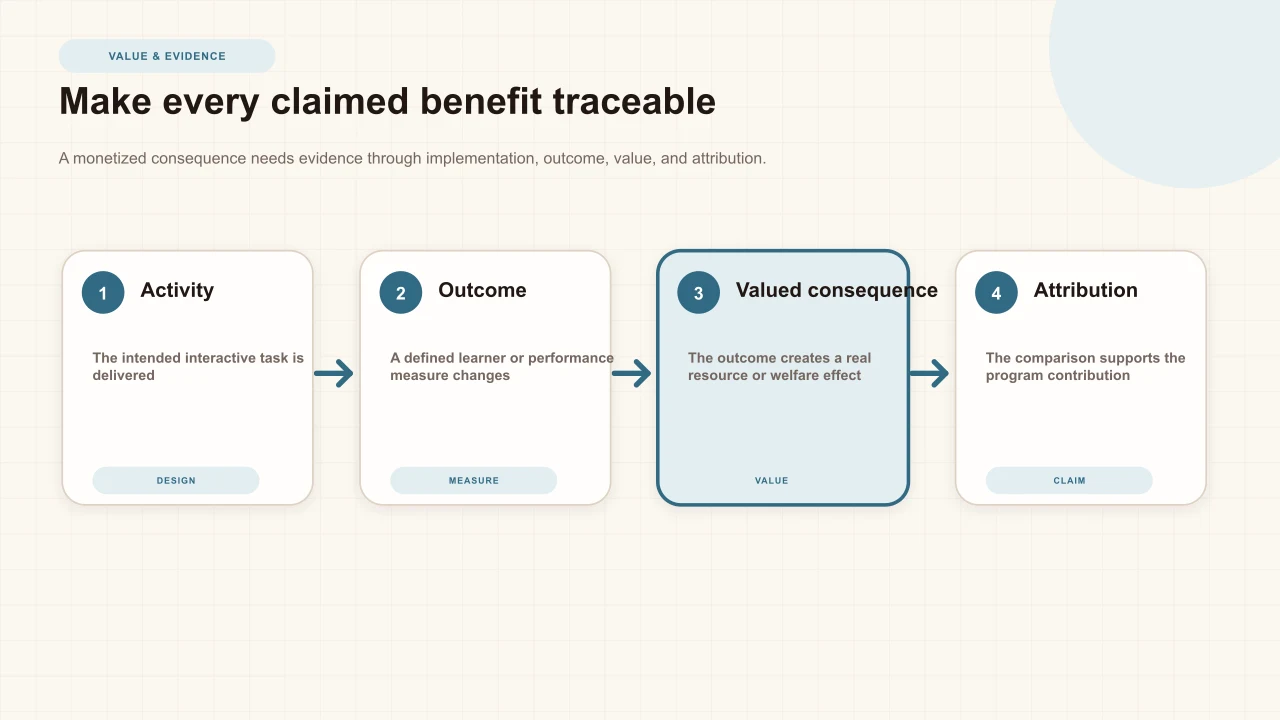
Build an evidence chain from activity to output, outcome, valued consequence, and attribution. Product analytics may show that a session occurred, a response was selected, a configured completion rule was met, or watch activity was recorded. A validated assessment may support an inference about learning. Workplace observations or system records may describe performance. A credible comparison or impact design is needed before assigning the difference to the intervention.
The 2026 Magenta Book distinguishes process, impact, and value-for-money evaluation. Use process evidence to understand implementation and costs. Use impact methods appropriate to the causal question. Then compare value using evidence strong enough for the claim. The interactive-video pilot guide helps replace feasibility assumptions before a larger appraisal.
Do not monetize weak proxies
Completion, clicks, response counts, satisfaction, watch activity, and time on task can be useful implementation signals. They are not automatically benefits. A learner can complete without understanding, spend longer because the experience is confusing, or rate a pleasant lesson highly without changing performance. Keep the metric in its proper layer and state the interpretation limits.
Be equally careful with “time saved.” If a shorter lesson releases no usable capacity, the time may not create a cash benefit. If faster authoring leads to more content, the benefit may be increased capacity rather than reduced spending. If automated generation shifts work into review and correction, count the entire workflow. The completion-rate guide and engagement-heatmap guide show why behavioral metrics need context.
Use ranges and sensitivity analysis
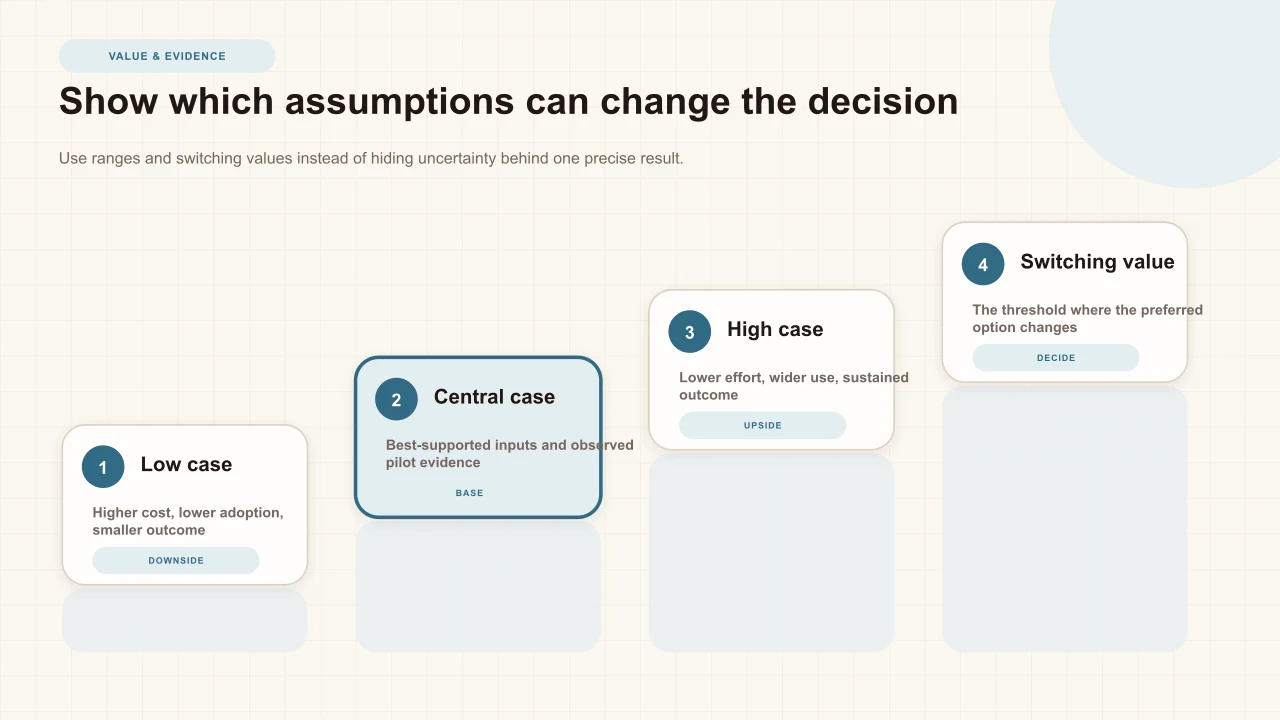
Replace fragile point estimates with low, central, and high cases. Vary the assumptions that could change the decision: number of lessons, authoring hours, learner volume, support demand, adoption, outcome size, persistence, maintenance, and the proportion of observed change attributed to the program. Identify the switching value—the point at which the preferred option changes.
Sensitivity analysis is not a ritual that makes weak inputs scientific. It shows decision makers which assumptions matter and where more evidence is valuable. The Green Book recommends communicating risk and uncertainty and cautions against spurious precision. Record source, owner, confidence, and update date for each material assumption.
Separate pilot economics from scale
A pilot often carries disproportionate setup and learning costs while serving few learners. Dividing that total by pilot participants can make the program appear permanently expensive. The opposite error is to spread setup cost across a large hypothetical rollout while assuming support, governance, and maintenance remain flat. Report observed pilot cost and a separate scale scenario with explicit assumptions.
Ask what changes at scale: author count, template reuse, localization, caption volume, device variation, accessibility review, identity, support, reporting, content ownership, and update frequency. Use the stakeholder buy-in guide to make the next investment decision and the content-governance guide to expose recurring ownership costs before they disappear from the model.
Report distribution and non-monetary value
A single net value can hide who benefits and who bears the burden. Report learner, instructor, administrator, support, and institutional effects separately where relevant. Consider accessibility, language, device, contract type, geography, and role. A workflow that saves central reporting time while shifting difficult support work to instructors is not accurately represented by one positive total.
Keep important non-monetized outcomes visible. Accessibility, learner autonomy, instructional quality, policy alignment, privacy risk, and equitable access may be material even without a defensible currency value. Present them beside the financial result with evidence, scale, and uncertainty. Do not convert every principle into speculative dollars merely to raise a ratio.
Interakly analytics boundaries
Interakly's current analytics can provide product-level evidence such as sessions, responses, configured completion, score, question patterns, and watch activity where supported. Those observations can inform implementation and learner-evidence questions. Interakly does not calculate organizational ROI, value staff time, measure workplace transfer, identify a counterfactual, or prove that the interactive experience caused an outcome.
Source mode matters. Uploaded media and YouTube have different interaction and playback boundaries, so the cost and outcome model must match the workflow that will operate. Verify current behavior in the editor, Preview, and published learner player. Treat exported or dashboard evidence as one input to the analysis, not as the financial model itself. Use the interactive-video design best-practices guide to keep release quality visible in the operating cost.
Build an honest appraisal summary
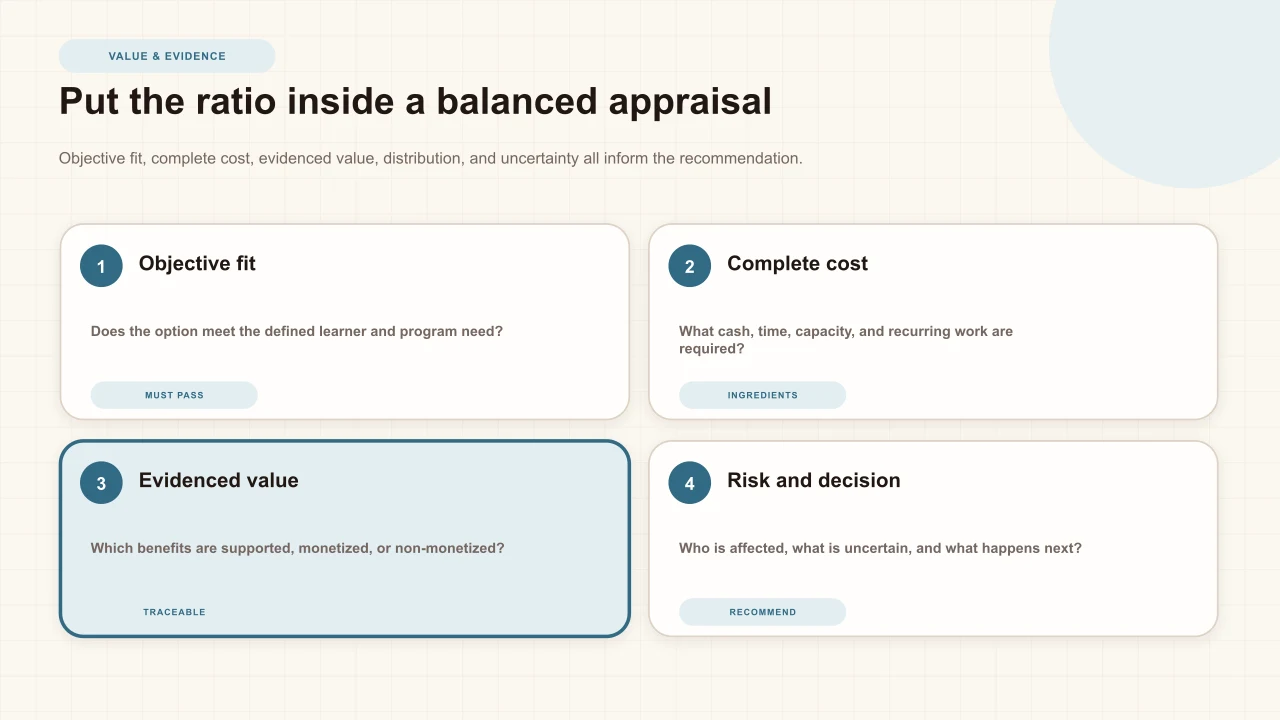
Decision and alternatives
State what is being chosen, by whom, for which population and time horizon.
Complete costs
Show ingredients, quantities, prices, time, setup, recurring operation, and scale assumptions.
Benefits and evidence
Define each outcome, evidence source, comparison, attribution limit, and monetary treatment.
Risk and distribution
Report uncertainty ranges, switching values, non-monetized effects, and who bears each impact.
Recommendation
Choose adopt, pilot, revise, maintain the alternative, or stop, with conditions and a review date.
Sources and further reading
- IES Cost Analysis: A Starter Kit — ingredients, pricing, estimates, and sensitivity.
- IES Cost Analysis in Practice Project — education cost and cost-effectiveness resources.
- IES Cost-Feasibility Analysis Toolkit — affordability and resource decisions for online programs.
- HM Treasury Green Book 2026 — objectives, options, value, distribution, risk, and uncertainty.
- HM Treasury Magenta Book — process, impact, and value-for-money evaluation.
- CDC Program Evaluation Framework — credible evidence, conclusions, and action.
- IES Program Evaluation Toolkit — logic models, measures, analysis, and communication.
- U.S. GAO evidence-based policymaking practices — evidence use and continuous improvement.
FAQ
What is the ROI formula for interactive video?
A common financial expression is net benefit divided by cost, but the arithmetic is the easy part. The hard work is defining the decision, baseline, time horizon, attributable benefits, full costs, and uncertainty. In many learning decisions, cost-feasibility or cost-effectiveness is more defensible than a monetary ROI percentage.
Can completion rate be used as a financial benefit?
Not by itself. Completion describes session behavior under a configured rule. It may be useful implementation evidence, but converting it into money requires a justified chain from completion to an outcome and from that outcome to a valued consequence.
Should staff time count as a cost if salaries are already budgeted?
Yes when the decision consumes time that could have been used elsewhere. Record authoring, review, support, administration, and maintenance effort even when no new invoice is created. Whether it becomes a cash cost, opportunity cost, or capacity constraint depends on the analysis.
How should a small pilot report ROI?
Usually as observed cost, feasibility, implementation, and clearly bounded outcome evidence—not as a universal return forecast. Use the pilot to replace uncertain assumptions with ranges and to decide what stronger evaluation is justified before scale.
What if important benefits cannot be monetized?
Report them transparently beside monetized values. Accessibility, learner dignity, policy compliance, instructional clarity, risk reduction, and distributional effects can matter even when a credible currency value is unavailable. Do not force a speculative price merely to fit one ratio.
Does Interakly calculate organizational ROI?
No. Interakly provides current product and learner evidence such as sessions, responses, completion, score, and watch activity where supported. The organization must connect those observations to its own costs, outcome measures, comparison, and attribution design.
Measure the workflow before forecasting the return
Use a representative Interakly lesson to replace assumptions about authoring, access, learner behavior, support, and maintenance with observed evidence.
Explore corporate training